
Quick answer
The build-out rhymes; the builders are different
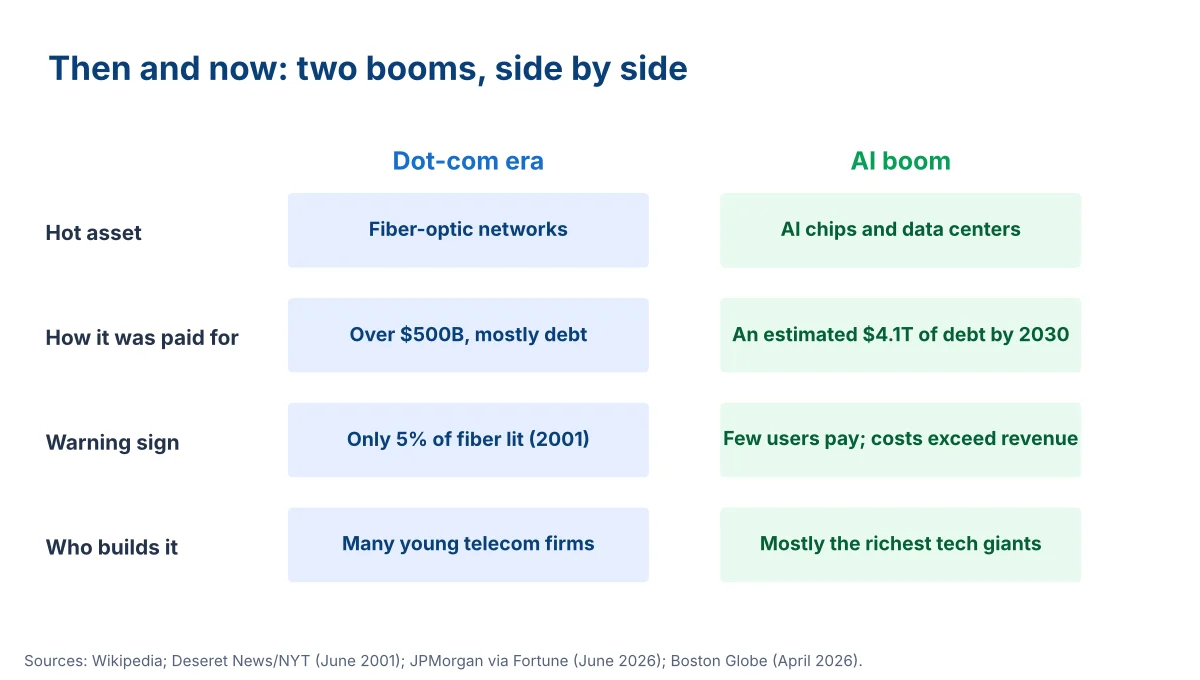
Both booms involve a huge rush to build infrastructure ahead of proven demand, much of it paid for with debt, and deals where suppliers help fund their own customers. The big difference is who is building: in 2000 it was many young companies with little revenue, while today it is mostly the most profitable companies in the world. That makes a slowdown less likely to wipe out the builders, but not risk-free.
The party in 2000
In the five years after the US changed its telecom laws in 1996, companies invested more than $500 billion, mostly borrowed, in fiber-optic cables, switches and wireless networks. Capacity grew far faster than demand. By June 2001, the New York Times reported that only about 5% of the fiber laid in the ground was active.
Then the bill came due. WorldCom collapsed in an accounting scandal in 2002. Bond investors in failed telecoms recovered just over 20% of what they had put in. Only about half of dot-com companies survived to 2004.
What looks the same
- Building ahead of demand. Then it was fiber; now it is chips and data centers, with Big Tech planning over $700 billion of spending in 2026.
- Borrowing to build. JPMorgan estimates $4.1 trillion of debt will finance the AI build-out by 2030.
- Suppliers funding customers. In the dot-com era, equipment makers such as Nortel, Lucent and Cisco lent money to customers who bought their gear. Today, Nvidia has announced large investments in AI companies that buy its chips, which analysts call circular.
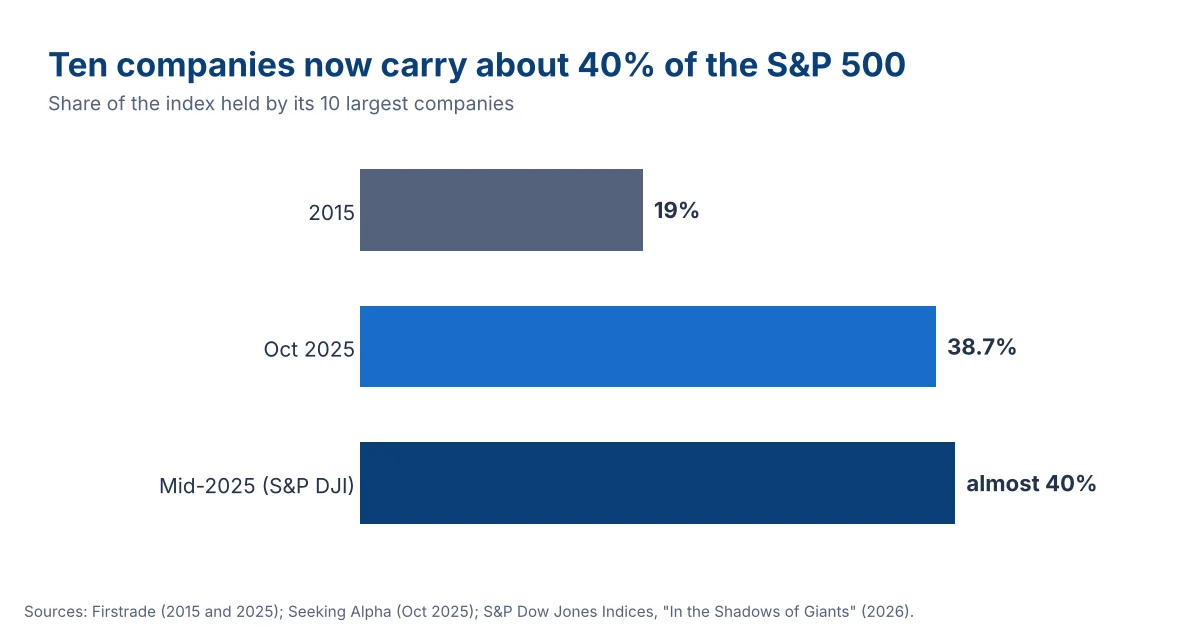
- A concentrated market. The ten biggest companies make up almost 40% of the S&P 500, a level S&P Dow Jones Indices says was last seen in the mid-1960s.
What is different
- The builders make money. Microsoft, Alphabet, Amazon and Meta earn huge profits from existing businesses. JPMorgan expects their operating cash flow to pass $900 billion a year by 2027.
- People already use the product. Hundreds of millions use AI chatbots, and businesses have signed long contracts: Microsoft reported $627 billion of future contracted revenue.
- Revenue is growing fast, even if it is still far below spending.
The twist in the dot-com story
The fiber was not wasted forever. After the crash, surviving carriers bought failed rivals' networks for much less than they cost to build and gradually lit the unused strands as internet traffic grew. The investors lost; the public got cheap bandwidth that made streaming and cloud computing possible.
That is the hopeful and the worrying lesson at once. A technology can be world-changing and still ruin many of the people who paid to build it too early.
- Track spending by category so a downturn never catches you without a plan.
- Use Accounts to see your assets, debt and net worth in one place.
- Review Insights monthly to spot changes early.
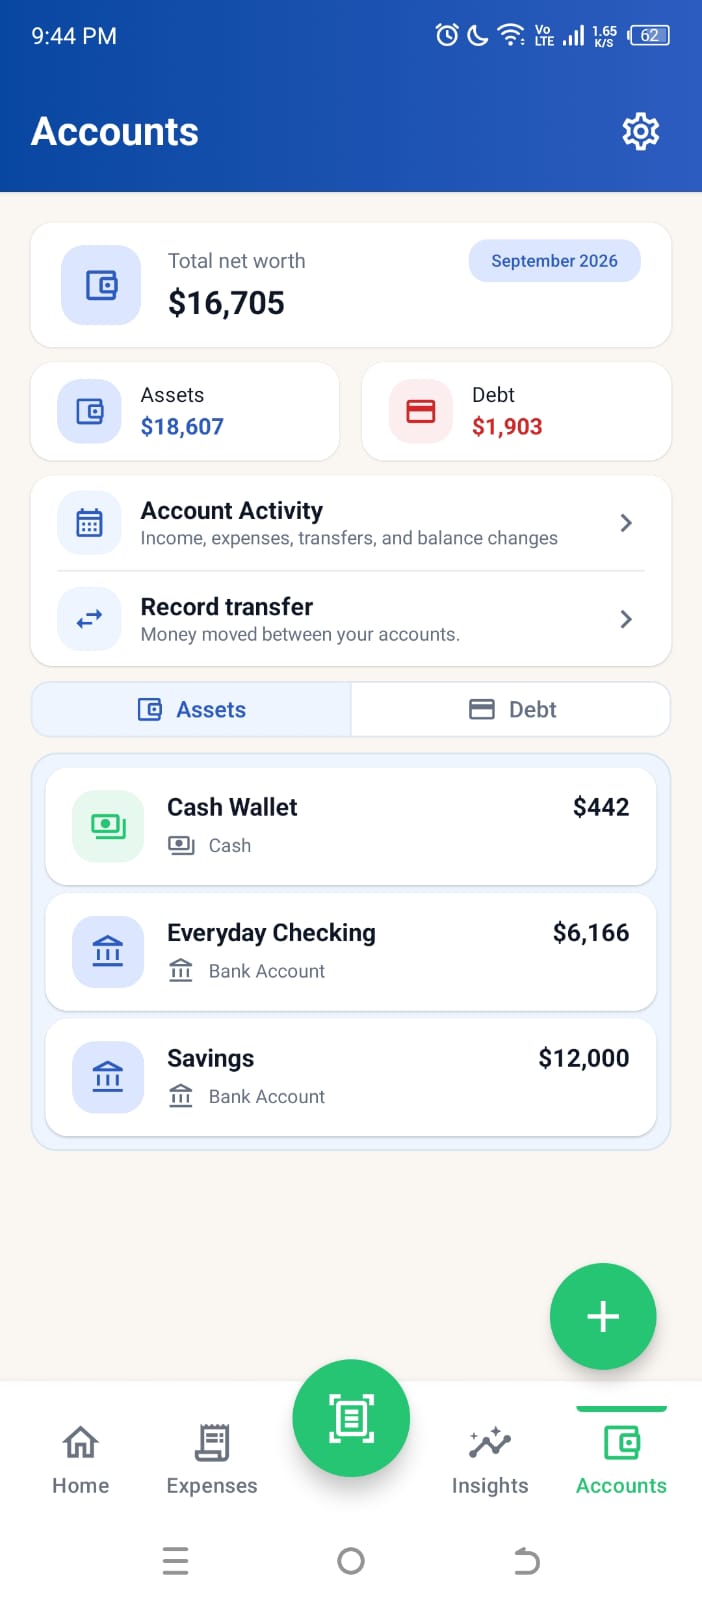
Screen shows sample data.
FAQ
Common questions
Is AI like the dot-com bubble?
In some ways: a rush to build infrastructure, heavy borrowing and circular deals. The biggest difference is that today's builders are very profitable companies.
What happened to the dot-com fiber?
Much of it sat unused after 2001. Surviving carriers later bought it cheaply and lit it as internet traffic grew.
How much did the Nasdaq fall in the dot-com crash?
About 78% from its March 2000 peak to October 2002.
Written with AI assistance by Higxel Editorial. Figures come from the sources listed; any example figures are labelled. This is general information, not financial or investment advice. Sources checked November 3, 2026. Some sources describe one country; local rules and costs differ.
Sources
Further reading
- Wikipedia: Dot-com bubble
- Deseret News / New York Times: economy's slump idles 95% of fiber-optic lines (June 2001)
- Fortune: Nvidia, OpenAI and circular financing (September 2025)
- S&P Dow Jones Indices: In the Shadows of Giants (2026)
- Fortune: JPMorgan on AI capex and debt (June 2026)
- TechFinitive (sponsored feature): what happened to the dot-com fiber